
Note: This article originally appeared June 23, 2014 on the IndySoft Corporation Blog
Let’s talk about custom report parameters, charting, and the dataset features in custom reports. If you have ever created a custom report that is intended to be used to display data for one specifically selected asset you may have tangled with the AutoSearch options in the data pipelines and some light coding in the Calc tab. In addition, you probably also had to launch the report then manually enter the company and ID of the asset to execute the search. We have a better way to address this in 9.
Today’s post is going to be a triple play. We’re going to show you how to:
- launch an event that autosearches based on the currently selected asset… right from the equipment view screen
- execute SQL commands within the report structure to create reusable looping datasets
- chart data points for historical calibrations along in a point-by-point control chart report
So today we’re going to create the classic Levey-Jennings chart with two standard deviations. A special thanks goes out to William Twentyman and Rhett Price at IndySoft who offered some best practices and additional information on query setups leading to the final solution.
 Example of a Levey-Jennings Chart
You’re going to need at least version 9.1 to create everything short of linking the report from within the equipment view. Version 9.1.8 and later will let you link to the report in the equipment view instead of just selecting the report from the reports menu.
In addition to the version requirements you should have an asset with the same number of test points over the asset history for a few years (no spec changes is also good but minor deviations may be ok).
Step 1 Creating an Auto-Search Report
Our first step is to open Printbuilder and after selecting the Custom reports option click the new button.
Creating a New Report
Enter Levey Jennings Report as the template name and select the Create New Report options followed by clicking OK. Double click the report entry and you’ll be at the default blank screen of a custom report.

The Default PrintBuilder Screen
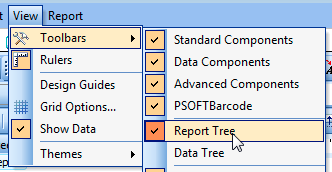
Go to the View -> Toolbars Menu and make sure Report Tree is enabled.

Enabling the Report Tree
Now we are going to add two search parameters to be added to this report.
Select the Parameters node under Report in the Report Tree then right mouse click it and select New. A parameter will be created ready for naming. Change the name to company and press enter.

Creating and Renaming Report Parameters
Right mouse click the parameters node once again and select New to create a second parameter called id then press enter.

View of the Completed Parameters
Now click the Data tab.
Click select File->New from the top menu followed by Query Wizard and OK.

Starting the Query Wizard
You may notice that Version 9 has a much more organized query wizard with user-friendly table names and sub-tables when major related information is available.
Scroll down in the list and double-click Equipment – Test Points to add it to the selected tables. Click Next.

Selecting the Database Table
Select to choose fields then add Equipment – Test Points.Company, Equipment – Test Points.I.D., and Equipment – Test Points.# followed by clicking next until you arrive at the Order step.

Selecting the Table Fields
Select to Set Order and add the Equipment – Test Points.# (sequence) field.

Setting the Sort Order
Now click Finish. It will be easier to modify our additional steps from a different screen. From the resulting data pipeline that was created, select the Search function to load Query Designer.

Launching the Search Parameters Option
Double click the Company and ID fields to load them in the lower criteria screen. From the criteria section set the Parameter for each field to the matching parameter name and set the AutoSearch field to yes. This will take values we will soon place in the parameters and automatically pass them to the query to execute our search for the test points associated with the asset.
Linking the Search Fields to the Parameters

Click OK to close the query designer.
Now click the Calc tab and from the View menu select Events to load the report objects view.

Enabling the Report Events View
Select Report from Report Objects on the left then from the right side select OnInitializeParameters from the Events window. Click in the lower left window and code formatting will appear.
Enter the following code between the begin and end; code lines
Report.Parameters['company'] := ReplaceSpecialFields('!COMPANY!');
Report.Parameters['id'] := ReplaceSpecialFields('!GAGE_SN!');
aCancel := False; |
Right mouse click the OnInitializeParameters and select compile. The icon next to the Event should turn green meaning no syntax errors.

Testing Code with the Compile Function
Explanation
ReplaceSpecialFields, and the !FIELD! syntax is special to IndySoft. It basically tells PrintBuilder to return the value of the currently selected !COMPANY! and !GAGE_SN! and place them into the two report parameters we created. From there they are available to the query and automatically execute a search for that company and asset when launching the report.
Step 2 Basic Report Layout and Adding Our Chart
Now flip to the Design tab and let’s build up some fields and a chart for our report. Start by selecting Report->Pass Settings and ensure this option is set to One Pass. We want this report to run everything top-down with no need to do an additional pass on the data for further calculations, etc.

Altering the Pass Settings for the Report
Our original query for the report simply searches for a given asset and returns the sequence of unique test points for that asset. For instance if we only have three test points for an asset we would get data similar to this:

Example of Data Results from the Main Pipeline
Our intent with this report is to create one chart per test point that reflects the findings for that test point across all history. In the Design tab expand the Header group and drop two data labels setting them to Equipment Company, and Equipment ID.

Adding Company and ID Fields to the Report
To create a chart per test point we need to use grouping. Again from the Report menu select Groups.

Launching the Group Options for the Report
Select to Break on Data Field and set the dropdown below that option to Equipment_Test_Points.# and click Add. This is telling the report that each new instance of a sequence number defines a group and where the data “starts over” so to speak. Uncheck the Keep group together and Reprint group options as this can sometimes lead to duplicate data if a section of a report carries over to a second page. Finally click OK to close this dialog.

Setting the Group Breaking Options
Expand the Group header and add a label with the caption of Sequence. This will show us the test point number each time we navigate to the next row of data. Now add a data aware label in the header and set it to the Equipment_Test_Points # field.

Adding the Test Point Number to the Report
Now close up the Detail band and expand the Group Footer to drop a Chart control in the footer area. Resize it to effectively fill the area. Now either hold and release the mouse on the Chart name in the Report Tree to invoke the rename option or simply change the Identity name in the properties window to Findings.

Adding the Chart to the Group Footer
Building the Chart
If you’ve never used the Chart component before you may find the wealth of features a little overwhelming at first. The best way to understand all the various settings is to simply get used to actually filling a chart, then work with the various settings and changing to preview mode to view the results. For our post we are going to perform minimal work just to get a chart on screen. Right mouse click the chart and select Edit Chart.

Accessing the Chart Editor
Our first goal is to alter the basic look and feel of the chart itself followed by adding what are called Data Series which we will populate with our test point data to draw the chart lines. Navigate to Chart->3D in the Chart options and turn off the 3 Dimensions options because 3D will just add visual clutter to the chart layout by causing overlaps.

Turning off the 3D Reporting Option
Now select the Series option in the top left. From the right side click Add followed by double clicking the Line option in the Standard tab. This will create a series in the view. Perform this same step seven more times. Then selecting each in order click the Title button and change the titles to As Found, Upper Limit, +2, +1, Nominal, -1, -2, and Lower Limit.

Creation of the Report Series
Now from the left side you can expand the Series group and select each series to edit the line options, etc. You can set each line color, option, etc but for now set the As Found series Point to visible and Square then click Close.

Enabling Point Markers for the As Found Data
Step 3 Adding Code to Generate Chart Data
Now all that is left is to add some code to query the database for our historical test points then using that data fill the chart and calculate our standard deviation lines. Add a non-data-aware variable to the group header and set the visible property to false (unchecked). We are going to add our code to the OnCalc event for this variable.

Adding a Variable Component to the Group Header
Variables vs OnPrint Events
If you are a seasoned PrintBuilder user you be wondering why we are using a hidden variable instead of an OnPrint event for coding. Every report has a best-fit way of handling things but generally speaking variables are far more predictable and easier to control than OnPrint events because the timing can be set manually. In the case of OnPrint, it can fire multiple times for regions, on page navigation, on File-Print vs Preview, etc. Once you get used to the variable approach, you will likely find more predictable report behavior and settle on it as your working standard.
While in the properties for the variable look for a setting under Calculations called ResetComponent and click the triple dot [...] button in the right side of that entry.

Launching the Group Timing Options
This will open the variable timing window which lets us tell the report exactly when to execute our chart code. By using calculate on Traversal and Reset On DataPipelineTraversal we are telling the report to run the code when it makes a data pass and reset itself each time it makes a pass of the data.

Setting the Group Timing Options
Click the Calc Tab and from the Report Objects tree select Groups->Variable1 then click the OnCalc event to create a code window. Enter the following code where var immediately follows the procedure opening line and end; completes all the code:
var
  iTotalPoints, iSEQ : Integer;
  dPointsTotal, dPointsAverage: Double;
  dRunningAvg, dStdDev: Double;
begin
  if Report.FirstPass = True then
  begin
    iSEQ := Equipment_Test_Points['#'];
    dPointsTotal := 0.0;
    dPointsAverage := 0.0;
    iTotalPoints := 0;
    tdDoSQLRecords(1,'SELECT GAGES.COMPANY, GAGES.GAGE_SN, EVENTS.EVENT_DATE, EVENTS.EVENT_TIME, EVENTS.EVENT_NUM, CALPNTS.SEQ, CALPNTS.LINE_STANDARD, CALPNTS.TOLERANCE1, CALPNTS.TOLERANCE2, CALPNTS.RESULT1, CALPNTS.RESULT2 FROM GAGES GAGES LEFT OUTER JOIN EVENTS EVENTS ON (EVENTS.COMPANY = GAGES.COMPANY) AND (EVENTS.GAGE_SN = GAGES.GAGE_SN) LEFT OUTER JOIN CALPNTS CALPNTS ON (CALPNTS.EVENT_NUM = EVENTS.EVENT_NUM) WHERE ( GAGES.COMPANY = '''+Report.Parameters['company']+''' ) AND ( GAGES.GAGE_SN = '''+Report.Parameters['id']+''' ) AND ( EVENTS.EVENT_TYPE = ''CALIBRATION'' ) AND (CALPNTS.SEQ = ' + IntToStr(iSEQ) + ')  ORDER BY GAGES.COMPANY, GAGES.GAGE_SN, CALPNTS.SEQ, EVENTS.EVENT_DATE, EVENTS.EVENT_TIME');
    tdFirst(1);
    while tdEOF(1)='0' do
    begin
      Findings.Chart.Series[1].Add(tdFieldByNameAsFloat(1,'TOLERANCE2'),tdFieldByNameAsString(1,'EVENT_DATE'),clRed);
      Findings.Chart.Series[0].Add(tdFieldByNameAsFloat(1,'RESULT1'),tdFieldByNameAsString(1,'EVENT_DATE'),clBlue);
      Findings.Chart.Series[4].Add(tdFieldByNameAsFloat(1,'LINE_STANDARD'),tdFieldByNameAsString(1,'EVENT_DATE'),clGreen);
      Findings.Chart.Series[7].Add(tdFieldByNameAsFloat(1,'TOLERANCE1'),tdFieldByNameAsString(1,'EVENT_DATE'),clRed);
      iTotalPoints := iTotalPoints + 1;
      dPointsTotal := dPointsTotal + tdFieldByNameAsFloat(1,'RESULT1');
      tdNext(1);
    end;
    dPointsAverage := dPointsTotal / iTotalPoints;
    dRunningAvg := 0.0;
    dStdDev := 0.0;
    tdFirst(1);
    while tdEOF(1)='0' do
    begin
      dRunningAvg := dRunningAvg + Sqr(tdFieldByNameAsFloat(1,'LINE_STANDARD') - dPointsAverage);
      tdNext(1);
    end;
    dStdDev := Sqrt(dRunningAvg/iTotalPoints);
    tdFirst(1);
    while tdEOF(1)='0' do
    begin
      Findings.Chart.Series[2].Add((tdFieldByNameAsFloat(1,'LINE_STANDARD')+(dStdDev * 2)),tdFieldByNameAsString(1,'EVENT_DATE'),clGray);
      Findings.Chart.Series[3].Add((tdFieldByNameAsFloat(1,'LINE_STANDARD')+(dStdDev * 1)),tdFieldByNameAsString(1,'EVENT_DATE'),clGray);
      Findings.Chart.Series[5].Add((tdFieldByNameAsFloat(1,'LINE_STANDARD')-(dStdDev * 1)),tdFieldByNameAsString(1,'EVENT_DATE'),clGray);
      Findings.Chart.Series[6].Add((tdFieldByNameAsFloat(1,'LINE_STANDARD')-(dStdDev * 2)),tdFieldByNameAsString(1,'EVENT_DATE'),clGray);
      tdNext(1);
    end;
  end;
end; |
Explanation
A set of variables is created to store the total number of test points and sum the as found values (iTotalPoints, dPointsTotal). The tdDoSQLRecords, a new function in Version 9, allows us to create inline queries that return multiple records from the database (a dataset) which we can then loop starting from the first record (tdFirst, tdNext, while not tdEOF) as many times as required for various purposes.
The first time we loop the dataset we are plotting the nominal, as found, and tolerance information while also gathering the total points and summing the as found values in order to calculate our average finding.
The second loop of the data is summing the square of the difference between the nominal and average finding which is then divided by the total points and used in the square root function to derive our standard deviation.
The final loop of the data plots the standard deviation lines at one and two times the value from the nominal.
Now for two final snippets of code.
From the Calc tab select View->Module and select Programs from the Module View.

Switching to the Report Module View
Right mouse click the right view and select to add a new procedure.

Adding a New Procedure
Change the procedure name in the code view to ResetChartData and enter this code:
if Report.FirstPass = True then begin Findings.Chart.Series[0].Clear; Findings.Chart.Series[1].Clear; Findings.Chart.Series[2].Clear; Findings.Chart.Series[3].Clear; Findings.Chart.Series[4].Clear; Findings.Chart.Series[5].Clear; Findings.Chart.Series[6].Clear; Findings.Chart.Series[7].Clear; end; |
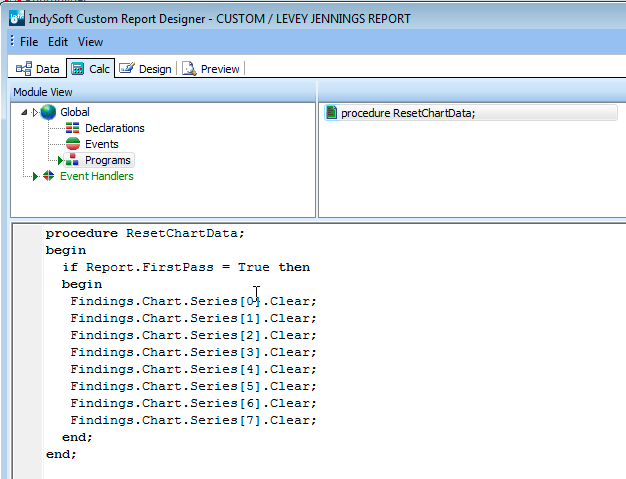
Creation of the Reset Chart Procedure
Now select View Events and select the Groups node in Report Objects. Click the AfterGroupBreak event and add
ResetChartData; |
to the resulting code view.

Calling ResetChartData on the Group Break
Explanation
As our chart is generated by the Variable1 OnCalc we must reset the chart data as the test point sequences changes. This occurs in the AfterGroupBreak event. If we did not execute the reset our first chart (in the case of three test points) would have data for test point one, the second chart would have the data for test point one and two, and the third chart would have test point data for all three test points.
Running the Report
Select the Preview tab and if you followed every step you should see a chart for each test point for the selected asset with automatically calculated upper and lower standard deviation levels.

Example of a Final Levey-Jennings Chart
Step 4 Linking the Report to the Reports Menu and Equipment View
Save and close the report and printbuilder. From Profile Manager select Management->Equipment Searching / Reports / Layouts from the top menu. Select New then create your report as a menu option as follows:
Linking the Report to the Reports Menu

Upon relaunch of IndySoft the report will appear in your Reports menu under the Analysis sub menu.
As an option you may wish to launch the report from the Equipment View. Simply go into LayoutBuilder for the desired equipment view, add a button or text, then highlight it and double click the Levey-Jennings Report option from the Custom Reports Hyperlink Group.
Where to Go From Here
We’ve only scratched the surface of the reporting and charting options in IndySoft. One of the first things you will likely want to do is tweak the chart lines, colors, etc. which is easily handled in both the editor and minor modification of the Variable1 code in regards to the color names at the end of each line plot command.
Conclusion
The latest release of Printbuilder in tandem with version 9 features offers tons of flexibility in generating asset-specific reports and advanced charting. In this tutorial you learned about:
- Passing parameters to reports
- Report timings and using Variables instead of OnPrint events
- Creating charts manually
- The new tdDataSet controls
- Adding reports to the reports menu and layout views
Want to learn more? Remember that along with our products IndySoft offers a wide array of services from Training to Advanced Reporting and Configuration. Feel free to contact your IndySoft Sales representative for assistance in selecting the right mix of services to maximize your investment in IndySoft solutions.